


If you’ve worked in SEO over the past few years, you’ve probably heard people obsess over Core Web Vitals. And honestly, for good reason. Google has been pushing site experience harder every year, and in 2026, Core Web Vitals still play an important role in technical SEO and search visibility.
The confusing part is that many articles online are already outdated. Some still talk about FID even though Google officially replaced it with INP in March 2024. Others focus too much on Lighthouse scores while ignoring real-world user data, which is what Google actually uses.
This guide breaks everything down in plain English. You’ll learn what Core Web Vitals are, the latest thresholds for 2026, how Google measures them, why they matter for SEO, and most importantly, how to improve them without wasting time on meaningless optimizations.
What Are Core Web Vitals?
Core Web Vitals (CWV) are Google’s way of measuring real-world user experience on a website. Instead of only looking at content and backlinks, Google also evaluates how fast, responsive, and visually stable a page feels for actual visitors.
Core Web Vitals are part of Google’s broader “Page Experience” system. The goal is simple: websites should not only provide useful content, but also deliver a smooth experience.
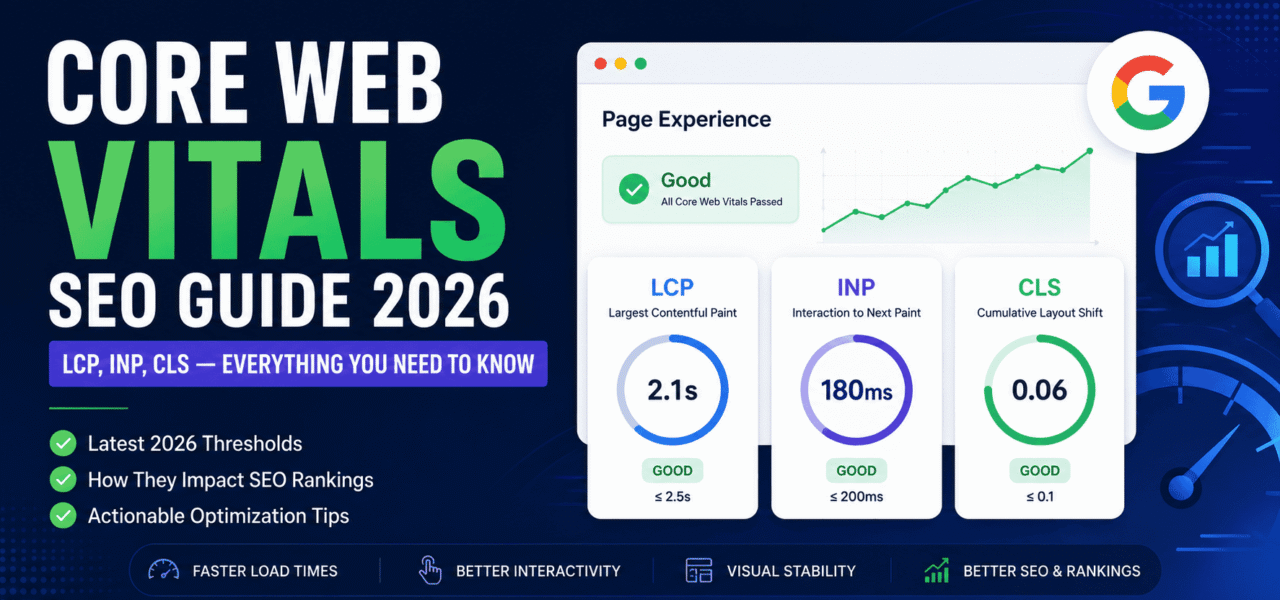
The current Core Web Vitals metrics are:
- LCP (Largest Contentful Paint)
- INP (Interaction to Next Paint)
- CLS (Cumulative Layout Shift)
Google retired FID (First Input Delay) in March 2024 and replaced it with INP because INP measures responsiveness more accurately across the entire lifetime of a page.
One important thing many people misunderstand is this:
Google primarily uses field data, not lab data.
That means Google looks at real user experience collected from Chrome users through the Chrome UX Report (CrUX). Your Lighthouse score alone does not determine your rankings.
Current Core Web Vitals Thresholds (2026)
As of 2026, these are the official performance thresholds Google uses:
| Metric | Good | Needs Improvement | Poor |
|---|---|---|---|
| LCP | ≤ 2.5s | 2.5s – 4.0s | > 4.0s |
| INP | ≤ 200ms | 200ms – 500ms | > 500ms |
| CLS | ≤ 0.1 | 0.1 – 0.25 | > 0.25 |
Google evaluates Core Web Vitals using the 75th percentile of page visits. That means your site doesn’t need to be perfect for every single user, but most visitors should have a good experience.
This distinction matters because averages can hide performance problems. If a significant portion of users on slow devices or weak mobile networks struggle with your site, your CWV scores can still fail even if your own testing looks fine.
Metric 1 — LCP (Largest Contentful Paint)
Largest Contentful Paint measures loading performance.
More specifically, it tracks how long it takes for the largest visible content element on a page to fully render. In most cases, that element is one of these:
- Hero image
- Featured image
- Large heading
- Banner section
- Video poster image
If users stare at a blank or incomplete page for too long, your LCP score suffers.
What Causes Poor LCP?
Slow Server Response Time
If your server takes too long to respond, everything else gets delayed too. This is often called poor TTFB (Time to First Byte).
Common causes include:
- Cheap hosting
- Slow CMS configurations
- Unoptimized database queries
- Too many plugins
- No caching layer
Render-Blocking Resources
CSS and JavaScript files can block the browser from rendering visible content.
For example, if the browser must download several large CSS files before showing anything on screen, your LCP increases.
Poor Image Optimization
Large hero images are one of the biggest CWV problems on modern websites.
Common issues include:
- Oversized images
- Incorrect formats
- No compression
- Lazy loading the LCP image
That last point is critical: your LCP image should generally NOT use lazy loading because it delays rendering.
Slow Frontend Frameworks
Heavy JavaScript frameworks can also delay rendering, especially on mobile devices with slower CPUs.
How to Improve LCP
Improve TTFB
Start with the server side.
Ways to reduce server response time include:
- Use high-performance hosting
- Add server-level caching
- Use a CDN
- Optimize database queries
- Remove unnecessary plugins
A CDN can dramatically improve global loading speed by serving assets closer to users.
Preload the LCP Image
If your hero image is the LCP element, preload it so the browser prioritizes downloading it immediately.
Example:
<link rel="preload" as="image" href="hero-image.webp">
Use Modern Image Formats
Switching from PNG or JPEG to WebP or AVIF can significantly reduce image size without sacrificing quality.
AVIF typically offers the best compression, though WebP has wider compatibility.
Inline Critical CSS
Critical CSS includes the styles required to render above-the-fold content.
Inlining critical CSS allows the browser to display visible content faster instead of waiting for large external stylesheets.
Reduce Render-Blocking JavaScript
Use techniques like:
- Deferred scripts
- Async loading
- Code splitting
- Removing unused JavaScript
Smaller JavaScript bundles improve both LCP and INP.
Metric 2 — INP (Interaction to Next Paint)
INP stands for Interaction to Next Paint.
This metric replaced FID because FID only measured the first user interaction. INP is much more comprehensive because it measures responsiveness across the entire page lifecycle.
Whenever a user:
- Clicks
- Taps
- Types
- Interacts with menus or forms
INP evaluates how quickly the page visually responds.
Google considers an INP score below 200 milliseconds good.
Why INP Matters More Than FID
FID was limited because it only looked at the first interaction delay.
A page could technically pass FID while still feeling slow and frustrating later on.
INP solves this problem by evaluating the longest interaction delay during the visit. This creates a more realistic picture of user experience.
In practice, INP is harder to optimize than FID because it exposes JavaScript performance problems throughout the entire session.
What Causes Poor INP?
Long JavaScript Tasks
When JavaScript blocks the browser’s main thread for too long, the page becomes unresponsive.
Users click buttons but nothing happens immediately.
This is one of the most common causes of poor INP scores.
Heavy Event Handlers
Some websites run expensive computations every time users interact with the page.
Examples include:
- Large filtering systems
- Complex animations
- Massive DOM updates
- Poorly optimized React renders
Excessive Third-Party Scripts
Marketing tags, analytics tools, chat widgets, and ad scripts often introduce performance bottlenecks.
Many sites unknowingly load dozens of third-party scripts that compete for browser resources.
Large DOM Size
Very large pages with deeply nested HTML structures make rendering and interaction slower.
How to Improve INP
Break Up Long Tasks
Instead of executing huge JavaScript operations all at once, split them into smaller chunks.
Developers often use:
setTimeout()
or
requestIdleCallback()
to yield control back to the browser.
This keeps the UI responsive.
Reduce JavaScript Payload
Less JavaScript usually means better responsiveness.
Remove:
- Unused libraries
- Legacy plugins
- Redundant scripts
- Heavy frameworks where unnecessary
Use Web Workers
Heavy calculations can run in Web Workers instead of blocking the main browser thread.
This is especially useful for:
- Data processing
- Complex filtering
- Large computations
Optimize Event Handlers
Avoid expensive logic inside click and input events.
Efficient event handling dramatically improves interaction responsiveness.
Minimize DOM Complexity
Simpler pages generally perform better.
Reducing unnecessary wrappers and deeply nested structures helps browsers update the UI faster.
Metric 3 — CLS (Cumulative Layout Shift)
CLS measures visual stability.
In simple terms, it tracks how much elements unexpectedly move around while the page loads.
Everyone has experienced this before:
You try to click a button, then suddenly the layout shifts and you click something else instead.
That’s a CLS issue.
Google considers a CLS score below 0.1 good.
What Causes Poor CLS?
Images Without Dimensions
If browsers don’t know image dimensions ahead of time, they can’t reserve space properly.
When the image finally loads, the layout shifts.
Ads Injecting Late
Ads are one of the biggest CLS offenders.
If ad containers don’t reserve fixed space, content jumps around once ads appear.
Web Font Swaps
Custom fonts can cause layout changes when the fallback font gets replaced.
This is commonly known as FOUT (Flash of Unstyled Text).
Dynamic Content Injection
Inserting banners, notifications, or forms above existing content during loading can create major layout instability.
How to Improve CLS
Add Width and Height Attributes to Images
Always specify image dimensions.
Example:
<img src="image.webp" width="1200" height="800" alt="">
This allows browsers to reserve the correct layout space before images load.
Reserve Space for Ads
Ad containers should always have predefined dimensions using CSS.
Never let ads dynamically push content downward.
Optimize Font Loading
Using:
font-display: swap;
or
font-display: optional;
helps reduce layout instability caused by font rendering.
Choosing fallback fonts with similar dimensions also minimizes shifts.
Avoid Injecting Content Above Existing Content
Be careful with popups, banners, cookie notices, and announcements.
If new elements appear above already visible content, users experience layout jumps.
How to Measure Core Web Vitals
One of the biggest mistakes people make is relying on a single testing tool.
Different tools provide different types of data.
Lab Tools
Lab tools simulate performance in controlled environments.
They’re useful for debugging and development.
PageSpeed Insights
PageSpeed Insights combines both lab data and field data.
It’s usually the best starting point because it shows:
- Real user data
- Lighthouse diagnostics
- Optimization suggestions
Lighthouse
Lighthouse runs directly inside Chrome DevTools.
It provides lab-only measurements and is excellent for identifying frontend bottlenecks.
However, Lighthouse scores do not represent actual Google ranking data.
WebPageTest
WebPageTest provides advanced waterfall analysis and visual rendering insights.
It’s especially useful for diagnosing:
- Render-blocking resources
- CDN issues
- Server delays
- Third-party script impact
Field Data Tools
Field data reflects real user experience.
This is the data Google uses for rankings.
Google Search Console
The Core Web Vitals report inside Google Search Console is one of the most important SEO tools available.
It groups pages into:
- Good
- Needs Improvement
- Poor
The data comes from real Chrome users over a rolling 28-day window.
CrUX Dashboard
The Chrome UX Report (CrUX) provides large-scale user experience data collected directly from Chrome users.
Many enterprise SEO teams analyze CrUX through:
- BigQuery
- Looker Studio dashboards
Real User Monitoring (RUM)
RUM platforms track actual visitor performance in real time.
Popular tools include:
- Sentry
- Datadog
- SpeedCurve
RUM is extremely valuable because it reveals issues affecting specific devices, browsers, regions, or network conditions.
Lab Data vs Field Data
This distinction is critical.
Lab data shows performance under simulated testing conditions.
Field data shows what actual users experience.
A site can achieve a strong Lighthouse score while still failing Core Web Vitals in Google Search Console.
Why?
Because real users may have:
- Slow phones
- Weak mobile networks
- Older browsers
- Heavy CPU limitations
Google ultimately cares about the real-world experience.
How Core Web Vitals Affect Rankings
There’s still confusion about how powerful Core Web Vitals really are for SEO.
Here’s the reality:
Core Web Vitals are important, but they are not stronger than content relevance or backlinks.
Google has repeatedly indicated that Page Experience acts more like a tiebreaker signal.
That means:
If two pages have similar content quality and authority, the page with better user experience may rank higher.
However, great content can still rank with mediocre CWV scores.
Why CWV Still Matters
Even if Core Web Vitals are not the strongest ranking factor, they still matter for several reasons.
Better User Experience
Fast, stable websites create happier users.
That usually improves:
- Engagement
- Conversions
- Bounce rates
- Session duration
Mobile Performance Is Critical
Google primarily evaluates mobile performance because of mobile-first indexing.
A desktop-fast site may still fail CWV badly on mobile devices.
Poor Pages Can Be Suppressed
Pages marked as “Poor” in Google Search Console may struggle competitively in search results, especially in crowded SERPs.
Faster Sites Usually Perform Better Overall
Performance optimization often improves:
- Crawl efficiency
- Accessibility
- UX
- Conversion rates
The SEO impact extends beyond rankings alone.
Common Core Web Vitals Mistakes
A few mistakes appear constantly across websites.
Chasing Lighthouse Scores Instead of Real Users
A perfect Lighthouse score does not guarantee strong field performance.
Always prioritize real-world data.
Lazy Loading Everything
Developers sometimes lazy load above-the-fold images, including the LCP element.
That usually hurts performance rather than helping it.
Ignoring Third-Party Scripts
Analytics tools, ads, heatmaps, and widgets can destroy INP and LCP scores.
Audit them regularly.
Optimizing Desktop Instead of Mobile
Many sites perform well on high-end desktop devices but fail badly on mobile.
Google prioritizes mobile experience.
Final Thoughts
Core Web Vitals remain one of the most important technical SEO concepts in 2026 because they directly measure how real users experience your website.
The three current metrics — LCP, INP, and CLS — focus on loading speed, responsiveness, and visual stability. Understanding how they work helps you prioritize the fixes that actually improve user experience instead of chasing vanity scores.
The biggest takeaway is simple: optimize for real users, not just testing tools. Google evaluates field data collected from actual visitors, especially on mobile devices.
Strong content still matters most in SEO, but when competing pages are similar, better performance and smoother user experience can absolutely make the difference.
Start by fixing your biggest bottlenecks first, monitor field data consistently, and treat Core Web Vitals as an ongoing optimization process rather than a one-time task.
Start with a complete technical SEO audit. TechySEO identifies the technical issues that drag down your Core Web Vitals scores — broken resources, redirect chains, missing image dimensions, and more. Start your free trial at https://techyseo.com
